
During my product management, we were required to do kano analysis on a product. As discussed in my previous post, I was using smart indoor garden system product as my subject for research. Therefore, I conducted Kano analysis on that. In this post we will study what is kano analysis and how it is does done with a case study.
What is Kano analysis?
Kano analysis is like a secret decoder ring for understanding what makes your customers happy, sad, or just meh about your product. Developed by Professor Noriaki Kano in the 1980s, this technique helps you categorize customer preferences into five main buckets, making it easier to figure out where to focus your efforts for the biggest impact. Here’s a quick rundown:
- Must-be Quality (Basic Needs): These are the non-negotiables. If you miss these, your customers are heading for the hills. Think of it like the brakes on a car; nobody gets excited about them, but you sure would miss them if they weren’t there.
- One-dimensional Quality (Performance Needs): Here’s where the action is. The better you do, the happier your customers are. It’s a direct relationship – like speed in a car. More horsepower, more smiles.
- Attractive Quality (Delighters): These are the pleasant surprises that make your customers’ day but won’t necessarily be missed if they’re absent. Like heated seats in a car – not essential, but oh-so-nice on a cold morning.
- Indifferent Quality: These features don’t really move the needle either way for your customers. It’s like having a choice of colors for the interior lights of the car. Neat, maybe, but not a dealbreaker.
- Reverse Quality: This one’s interesting because it’s about features that some customers might actually dislike. It’s akin to a car being too complicated to operate. For some, more buttons equal more problems.
By sorting customer feedback into these categories, Kano analysis gives you a map of what’s absolutely essential, what could win you brownie points, and what might not be worth your time or investment. It’s all about prioritizing features based on how they’ll affect customer satisfaction. This way, you can strategically invest in areas that will genuinely improve your product and make your customers happier.
How is it done?
Doing a Kano analysis is like hosting a party where your guests’ preferences shape the menu, music, and activities. It’s a mix of gathering insights, sorting them into categories, and then using this intel to plan the best possible experience. Here’s a step-by-step guide to get you started:
- Gather Customer Feedback: First up, you need to know what your customers think and feel. This could be through surveys, interviews, or any method that lets you collect their honest opinions about your product or service. The trick is to ask the right questions.
- Craft Kano Questions: Instead of asking directly what people want, Kano questions come in pairs for each feature:
- Functional Question: How do you feel if this feature is present?
- Dysfunctional Question: How do you feel if this feature is absent? Respondents typically choose from: I like it, I expect it, I am neutral, I can tolerate it, or I dislike it. This dual-question approach helps uncover not just what features are important but how their presence or absence influences satisfaction.
- Analyze Responses: With the feedback in hand, you’ll analyze it to classify features into the five Kano categories (Must-be, One-dimensional, Attractive, Indifferent, and Reverse). The patterns in how customers react to the presence or absence of features guide this classification.
- Prioritize Features: Once you’ve categorized the features, it’s time to prioritize. Must-be qualities are your baseline; they must be met. Performance attributes are your next priority, as improvements here directly boost satisfaction. Delighters are your secret weapon for exceeding expectations and creating memorable experiences.
- Incorporate Findings into Product Development: Use the insights from your analysis to inform your product development. Focus on maintaining must-haves, improving or adding performance features, and sprinkling in delighters to surprise and engage customers.
- Iterate and Reevaluate: Customer preferences can shift, and what was once a delighter might become expected over time. Regularly revisiting your Kano analysis helps keep your product or service in tune with customer needs.
The beauty of Kano analysis is that it’s both an art and a science. It’s about listening closely to your customers and then using that information to craft an experience that hits all the right notes. It requires a bit of detective work and a lot of empathy, but the payoff is a product that resonates with your audience on a deeper level.
Case study
We have gone through the theory so far, now let’s get into the actual practice. So, for my following Product Idea
PRODUCT IDEA-SMART INDOOR GARDEN SYSTEM
The Smart Indoor Garden System, tailored for space-constrained urbanites, merges home gardening with technology. This compact solution, ideal for growing herbs and vegetables indoors, caters to the growing demand for organic food and smart devices. It enhances lifestyle, promotes sustainable living, and aligns with modern preferences, transforming urban gardening experiences into an integral part of daily life.
Planned Product Feature List
I had following features planned.
- Efficient LED lighting.
- Basic App.
- High-quality plant nutrients.
- Compact, modular design.
- Educational content about gardening.
- Subscription service.
- Advanced AI.
Kano Survey
Next step was to design kano survey for my target audience, which basically was around 150+ fellow students. So, following is the structure and example of survey I created.
Survey structure.
- Introduction [about Product survey]
- Demography questions
- Age
- Location
- Prior experience with indoor gardening
- Features.
- Functional question
- Dysfunctional question
- [repeat for each feature]
- Example question
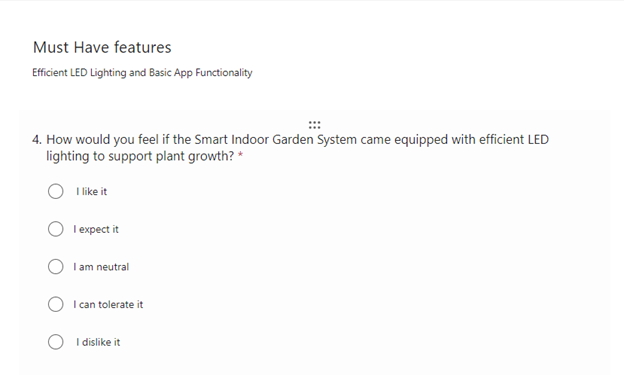
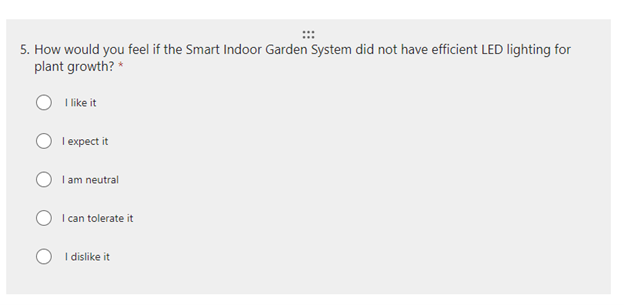
so created similar set for all my planned features.
Analyzing the responses
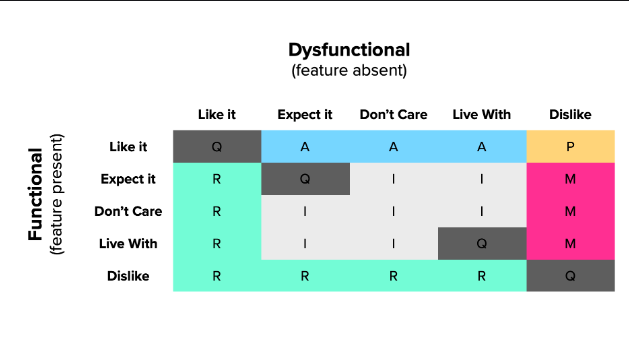
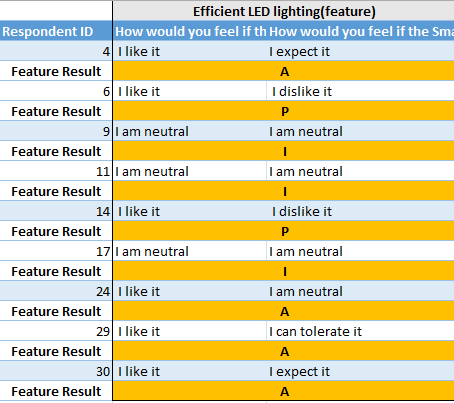
I received more than 30+ responses, I filtered them based on my targeted demography which was urbanites above 24 years old. I used evaluation table to interpret the responses as given at this website.
Kano evaluation table used to interpret responses as per foldingburritos.com/blog/kano-model/
Response Interpretation for one of the product features for a segment.
After interpreting the responses, I had my satisfaction index and dissatisfaction index for each feature as below:
Formula for satisfaction index = A%+P%/(A%+P%+M%+I%)
Formula for dissatisfaction index= M%+P%/(A%+P%+M%+I%)

Legend: M-mandatory (must have), P -Performance, A-attractive/delighting, I-Indifferent, R-Reverse, Q-Questionable
Plotting Dissatisfaction vs Satisfaction index on graph
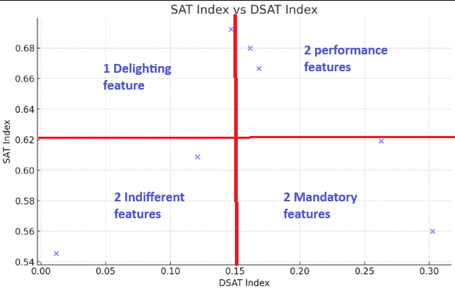
This is basically a 2-dimensional graph plotting DSAT index on x axis and SAT index on y axis. Lot of my fellow students got confused about this division using red color cross. This is just a logical distribution of attributes in four sections based on their actual values and their interpretation.
- Mandatory
- Performance
- Delighting
- Indifferent
Feature prioritization based kano analysis.

Product Road Mapping
Based on kano analysis I created product roadmap which looked like this
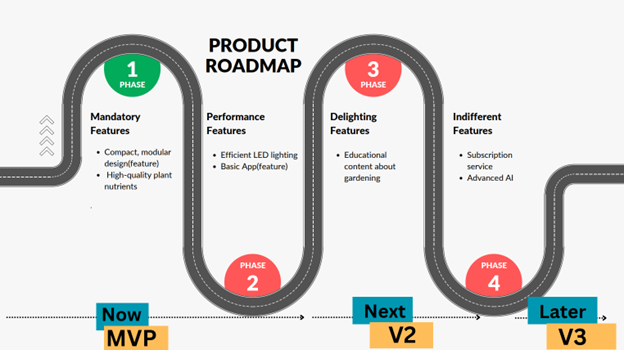
As we can see kano analysis is really useful in leveraging design thinking and putting your customer needs at the center of your product design.
[Call to action] : It’s a long post, written in hurry, if there are any parts which need more explanation please comment and I will try to explain it more.
